import matplotlib
from matplotlib import pyplot

import numpy as np

from common import draw_classic_axes, configure_plotting

configure_plotting()

pi = np.pi
Solutions for lecture 7 exercises
Warm up exercises
1. Check by yourself
2.
3.
4.
5. If the dispersion relation is parabolic, so in the free electron model.
Exercise 1: Lattice vibrations
1.
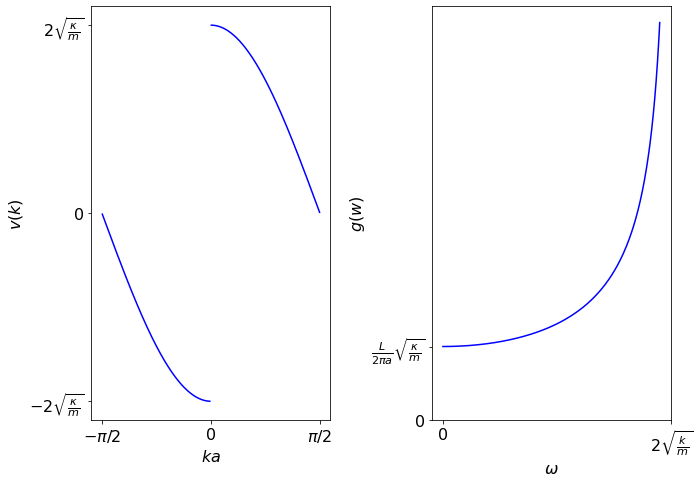
The group velocity is given by
2.
The density of states is
3.
pyplot.subplot(1,2,1) k = np.linspace(-pi+0.01, pi-0.01, 300) pyplot.plot(k[0:149], np.sin(k[0:149])/(np.sqrt(1-np.cos(k[0:149]))),'b'); pyplot.plot(k[150:300], np.sin(k[150:300])/(np.sqrt(1-np.cos(k[150:300]))),'b'); pyplot.xlabel(r'\(ka\)'); pyplot.ylabel('\(v(k)\)'); pyplot.xticks([-pi, 0, pi], [r'\(-\pi/2\)', 0, r'\(\pi/2\)']); pyplot.yticks([-np.sqrt(2), 0, np.sqrt(2)], [r'\(-2\sqrt{\frac{\kappa}{m}}\)', 0, r'\(2\sqrt{\frac{\kappa}{m}}\)']); pyplot.tight_layout();pyplot.subplot(1,2,2) w = np.linspace(0, 0.95, 300); g = 1/np.sqrt(1-w**2); pyplot.plot(w, g, 'b'); pyplot.xlabel(r'\(\omega\)'); pyplot.ylabel('\(g(w)\)'); pyplot.xticks([0, 1], [0, r'\(2\sqrt{\frac{k}{m}}\)']); pyplot.yticks([0.5, 1], [0, r'\(\frac{L}{2\pi a}\sqrt{\frac{\kappa}{m}}\)']); pyplot.tight_layout();
4.
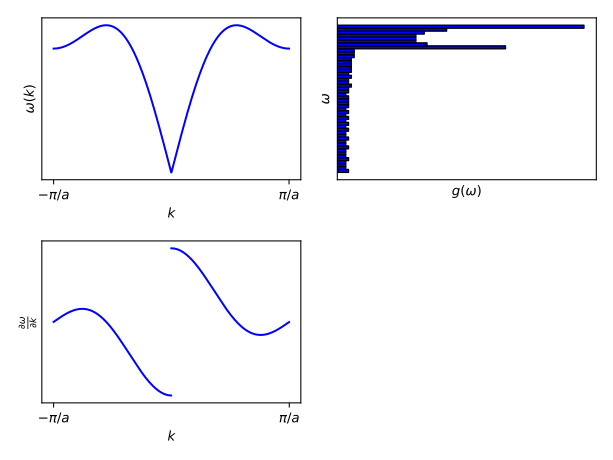
Hint: The group velocity is given as
Plots
Exercise 2: Vibrational heat capacity of a 1D monatomic chain
1.
For the energy we have: \(
2.
For the heat capacity we have: \(
Exercise 3: Next-nearest neighbors chain
1.
The Schrödinger equation is given by:
2.
Solving the Schrödinger equation yields dispersion: \(
3.
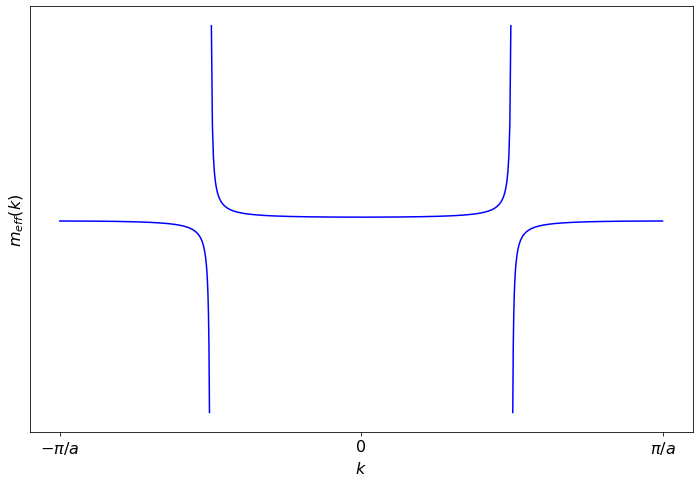
Plot for t=t':
k1 = np.linspace(-pi, -pi/2-0.01, 300);
k2 = np.linspace(-pi/2+0.01, pi/2-0.01, 300);
k3 = np.linspace(pi/2+0.01, pi, 300);

pyplot.plot(k1, 1/(5*np.cos(k1)),'b');
pyplot.plot(k2, 1/(5*np.cos(k2)),'b');
pyplot.plot(k3, 1/(5*np.cos(k3)),'b');
pyplot.xlabel(r'$k$'); pyplot.ylabel('$m_{eff}(k)$');
pyplot.xticks([-pi,0,pi],[r'$-\pi/a$',0,r'$\pi/a$']);
pyplot.yticks([],[]);
pyplot.tight_layout();
4.
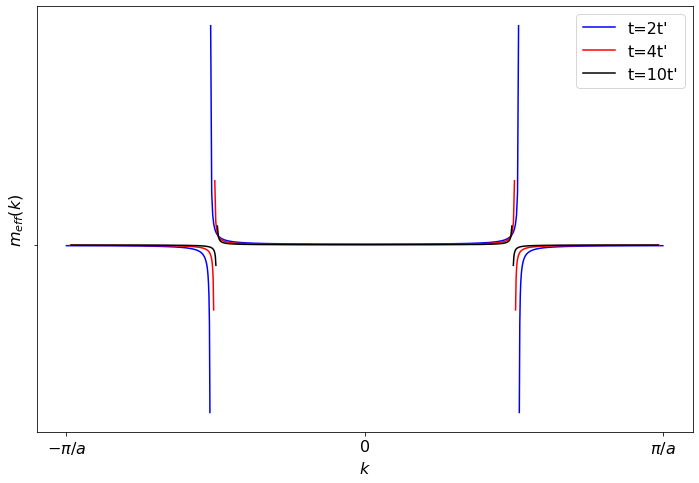
Plots for 2t'=t, 4t'=t and 10t'=t:
def m(k,t):
    return 1/(np.cos(k)+4*t*np.cos(2*k))

k1 = np.linspace(-1.6, -0.83, 300);
k2 = np.linspace(-0.826, 0.826, 300);
k3 = np.linspace(0.83, 1.6, 300);

pyplot.plot(k1, m(k1,2),'b');
pyplot.plot(k2, m(k2,2),'b');
pyplot.plot(k3, m(k3,2),'b',label='t=2t\'');
pyplot.xlabel('$k$'); pyplot.ylabel('$m_{eff}(k)$');
pyplot.xticks([-1.6,0,1.6],[r'$-\pi/a$',0,r'$\pi/a$']);
pyplot.yticks([0],[]);
pyplot.tight_layout();

k1 = np.linspace(-1.58, -0.81, 300);
k2 = np.linspace(-0.804, 0.804, 300);
k3 = np.linspace(0.81, 1.58, 300);

pyplot.plot(k1, m(k1,4),'r');
pyplot.plot(k2, m(k2,4),'r');
pyplot.plot(k3, m(k3,4),'r',label='t=4t\'');

k1 = np.linspace(-1.575, -0.798, 300);
k2 = np.linspace(-0.790, 0.790, 300);
k3 = np.linspace(0.798, 1.575, 300);

pyplot.plot(k1, m(k1,10),'k');
pyplot.plot(k2, m(k2,10),'k');
pyplot.plot(k3, m(k3,10),'k',label='t=10t\'');

pyplot.legend();